Monday, April 27, 2020

What Impact Might COVID-19 Have on Home Values?

What Impact Might COVID-19 Have on Home Values? | MyKCM
A big challenge facing the housing industry is determining what impact the current pandemic may have on home values. Some buyers are hoping for major price reductions because the health crisis is straining the economy.
The price of any item, however, is determined by supply and demand, which is how many items are available in relation to how many consumers want to buy that item.
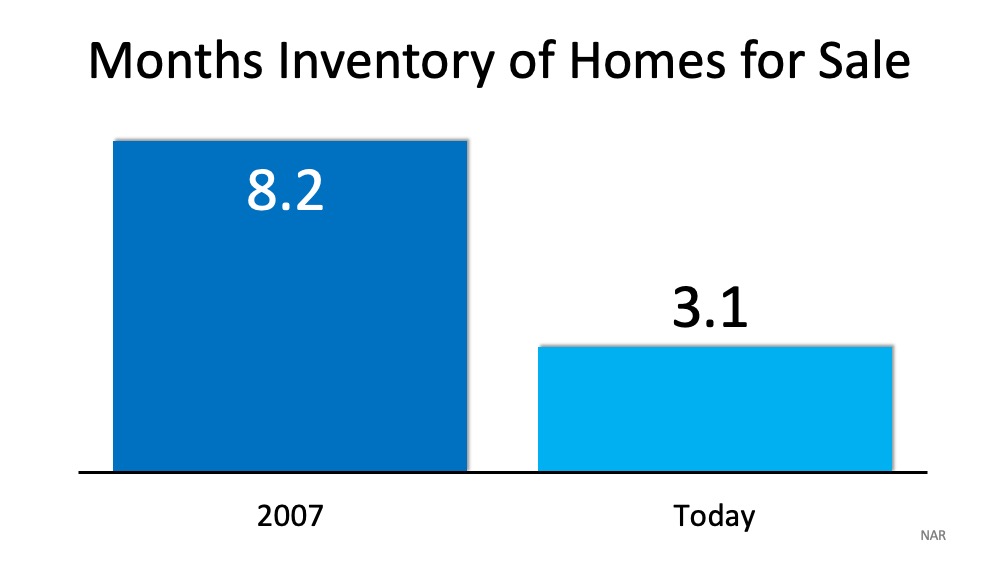
In residential real estate, the measurement used to decipher that ratio is called months supply of inventory. A normal market would have 6-7 months of inventory. Anything over seven months would be considered a buyers’ market, with downward pressure on prices. Anything under six months would indicate a sellers’ market, which would put upward pressure on prices.
Going into March of this year, the supply stood at three months – a strong seller’s market. While buyer demand has decreased rather dramatically during the pandemic, the number of homes on the market has also decreased. The recently released Existing Home Sales Reportfrom the National Association of Realtors (NAR) revealed we currently have 3.4 months of inventory. This means homes should maintain their value during the pandemic.
This information is consistent with the research completed by John Burns Real Estate Consulting, which recently reported:
“Historical analysis showed us that pandemics are usually V-shaped (sharp recessions that recover quickly enough to provide little damage to home prices).”

What are the experts saying?

Here’s a look at what some experts recently reported on the matter:
“Supported by our analysis of home price dynamics through cycles and other periods of economic and housing disruption, we expect home price appreciation to decelerate from current levels in 2020, though easily remain in positive territory year over year given the beneficial factors of record-low inventories & a historically-low interest rate environment.”
“The fiscal stimulus provided by the CARES Act will mute the impact that the economic shock has on house prices. Additionally, forbearance and foreclosure mitigation programs will limit the fire sale contagion effect on house prices. We forecast house prices to fall 0.5 percentage points over the next four quarters. Two forces prevent a collapse in house prices. First, as we indicated in our earlier research report, U.S. housing markets face a large supply deficit. Second, population growth and pent up household formations provide a tailwind to housing demand. Price growth accelerates back towards a long-run trend of between 2 and 3% per year.”
“The housing supply remains at historically low levels, so house price growth is likely to slow, but it’s unlikely to go negative.” 

Bottom Line

Even though the economy has been placed on pause, it appears home prices will remain steady throughout the pandemic.

Monday, April 20, 2020

The Pain of Unemployment: It Will Be Deep, But Not for Long

The Pain of Unemployment: It Will Be Deep, But Not for Long | MyKCM
There are two crises in this country right now: a health crisis that has forced everyone into their homes and a financial crisis caused by our inability to move around as we normally would. Over 20 million people in the U.S. became instantly unemployed when it was determined that the only way to defeat this horrific virus was to shut down businesses across the nation. One second a person was gainfully employed, a switch was turned, and then the room went dark on their livelihood.
The financial pain so many families are facing right now is deep.

How deep will the pain cut?

Major institutions are forecasting unemployment rates last seen during the Great Depression. Here are a few projections:
  • Goldman Sachs – 15%
  • Merrill Lynch – 10.6%
  • JP Morgan – 8.5%
  • Wells Fargo – 7.3%

How long will the pain last?

As horrific as those numbers are, there is some good news. The pain will be deep, but it won’t last as long as it did after previous crises. Taking the direst projection from Goldman Sachs, we can see that 15% unemployment quickly drops to 6-8% as we head into next year, continues to drop, and then returns to about 4% in 2023.
When we compare that to the length of time it took to get back to work during both the Great Recession (9 years long) and the Great Depression (12 years long), we can see how the current timetable is much more favorable.The Pain of Unemployment: It Will Be Deep, But Not for Long | MyKCM

Bottom Line

It’s devastating to think about how the financial heartache families are going through right now is adding to the uncertainty surrounding their health as well. Hopefully, we will soon have the virus contained and then we will, slowly and safely, return to work.

Monday, April 13, 2020

What You Can Do to Get Your House Ready to Sell [INFOGRAPHIC]

What You Can Do to Get Your House Ready to Sell | MyKCM

Some Highlights:

  • Believe it or not, there are lots of things you can do to prep your house for a sale without even going to the store.
  • Your real estate plans don’t have to be completely on hold even while we’ve hit the pause button on other parts of daily life.
  • Tackling small projects from cleaning the corners you may normally skip to tidying up your yard are easy and necessary wins if you’re thinking of listing your house and making a move.

Monday, April 6, 2020

The Housing Market Is Positioned to Help the Economy Recover [INFOGRAPHIC]

The Housing Market Is Positioned to Help the Economy Recover [INFOGRAPHIC] | MyKCM

Some Highlights

  • Expert insights are painting a bright future for housing when the economy bounces back – and it will.
  • We may be facing challenging economic times today, but the housing market is poised to help the economy recover, not drag it down.
  • Let’s connect to make sure you’re informed and ready when it’s time to make your move.

Monday, March 30, 2020

What You Can Do to Keep Your Dream of Homeownership Moving Forward [INFOGRAPHIC]

What You Can Do to Keep Your Dream of Homeownership Moving Forward [INFOGRAPHIC] | MyKCM

Some Highlights:

  • Don’t put your homeownership plans on hold just because you’re stuck inside.
  • There are several things you can do right now to keep your home search moving forward.
  • Connect with an agent, learn about resource programs for things like down payments, and get pre-approved today.

Monday, March 23, 2020

Economic Slowdown: What the Experts Are Saying

Economic Slowdown: What the Experts Are Saying | MyKCM
More and more economists are predicting a recession is imminent as the result of the pullback in the economy caused by COVID-19. According to the National Bureau of Economic Research:
“A recession is a significant decline in economic activity spread across the economy, lasting more than a few months, normally visible in real GDP, real income, employment, industrial production, and wholesale-retail sales.”
Bill McBride, the founder of Calculated Riskbelieves we are already in a recession:
“With the sudden economic stop, and with many states shutting down by closing down schools, bars and restaurants…my view is the US economy is now in a recession (started in March 2020), and GDP will decline sharply in Q2. The length of the recession will depend on the course of the pandemic.”

How deep will it go?

No one knows for sure. It depends on how long it takes to beat this virus. Goldman Sachsanticipates we will see a difficult first half of the year, but the economy will recover in the second half (see below):Economic Slowdown: What the Experts Are Saying | MyKCMGoldman also projects we’ll have “further strong gains in early 2021.” 
This aligns with the projection from Wells Fargo Investment Institute:
“Once the virus infection rate peaks, we expect a recovery to gain momentum into the final quarter of the year and especially into 2021.”
Again, no one knows for sure how long the pandemic will last. The hope is that it will resolve sometime over the next several months. Most agree that when it does, the economy will regain its strength quickly.
*QUARTER 1 DATA FROM GOLDMAN SACHS WAS UPDATED FROM 0% TO -0.2% ON 3/17/20 AFTER THE INITIAL RELEASE.

Bottom Line

This virus is not only impacting the physical health of Americans, but also the financial health of the nation. The sooner we beat it, the sooner our lives will return to normal.

Monday, March 16, 2020

5 Simple Graphs Proving This Is NOT Like the Last Time

5 Simple Graphs Proving This Is NOT Like the Last Time | MyKCM
With all of the volatility in the stock market and uncertainty about the Coronavirus (COVID-19), some are concerned we may be headed for another housing crash like the one we experienced from 2006-2008. The feeling is understandable. Ali Wolf, Director of Economic Research at the real estate consulting firm Meyers Research, addressed this point in a recent interview:
“With people having PTSD from the last time, they’re still afraid of buying at the wrong time.”
There are many reasons, however, indicating this real estate market is nothing like 2008. Here are five visuals to show the dramatic differences.

1. Mortgage standards are nothing like they were back then. 

During the housing bubble, it was difficult NOT to get a mortgage. Today, it is tough to qualify. The Mortgage Bankers’ Association releases a Mortgage Credit Availability Index which is “a summary measure which indicates the availability of mortgage credit at a point in time.” The higher the index, the easier it is to get a mortgage. As shown below, during the housing bubble, the index skyrocketed. Currently, the index shows how getting a mortgage is even more difficult than it was before the bubble.5 Simple Graphs Proving This Is NOT Like the Last Time | MyKCM

2. Prices are not soaring out of control.

Below is a graph showing annual house appreciation over the past six years, compared to the six years leading up to the height of the housing bubble. Though price appreciation has been quite strong recently, it is nowhere near the rise in prices that preceded the crash.5 Simple Graphs Proving This Is NOT Like the Last Time | MyKCMThere’s a stark difference between these two periods of time. Normal appreciation is 3.6%, so while current appreciation is higher than the historic norm, it’s certainly not accelerating beyond control as it did in the early 2000s.

3. We don’t have a surplus of homes on the market. We have a shortage.

The months’ supply of inventory needed to sustain a normal real estate market is approximately six months. Anything more than that is an overabundance and will causes prices to depreciate. Anything less than that is a shortage and will lead to continued appreciation. As the next graph shows, there were too many homes for sale in 2007, and that caused prices to tumble. Today, there’s a shortage of inventory which is causing an acceleration in home values.5 Simple Graphs Proving This Is NOT Like the Last Time | MyKCM

4. Houses became too expensive to buy.

The affordability formula has three components: the price of the home, the wages earned by the purchaser, and the mortgage rate available at the time. Fourteen years ago, prices were high, wages were low, and mortgage rates were over 6%. Today, prices are still high. Wages, however, have increased and the mortgage rate is about 3.5%. That means the average family pays less of their monthly income toward their mortgage payment than they did back then. Here’s a graph showing that difference:5 Simple Graphs Proving This Is NOT Like the Last Time | MyKCM

5. People are equity rich, not tapped out.

In the run-up to the housing bubble, homeowners were using their homes as a personal ATM machine. Many immediately withdrew their equity once it built up, and they learned their lesson in the process. Prices have risen nicely over the last few years, leading to over fifty percent of homes in the country having greater than 50% equity. But owners have not been tapping into it like the last time. Here is a table comparing the equity withdrawal over the last three years compared to 2005, 2006, and 2007. Homeowners have cashed out over $500 billion dollars less than before:5 Simple Graphs Proving This Is NOT Like the Last Time | MyKCMDuring the crash, home values began to fall, and sellers found themselves in a negative equity situation (where the amount of the mortgage they owned was greater than the value of their home). Some decided to walk away from their homes, and that led to a rash of distressed property listings (foreclosures and short sales), which sold at huge discounts, thus lowering the value of other homes in the area. That can’t happen today.

Bottom Line

If you’re concerned we’re making the same mistakes that led to the housing crash, take a look at the charts and graphs above to help alleviate your fears.